Stat Table
Use this stat if you need to display simple tabular data and don't need the full capabilities of ui.table.
Values can have custom font colors provided in hexadecimal, hsl, rgb, browser supported keywords (red, blue, green, etc), Wave colors.
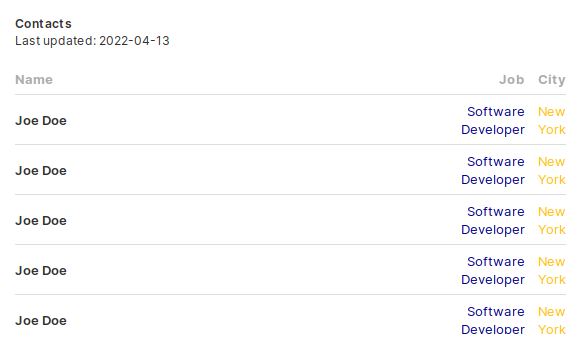
values = ['Software Developer', 'New York']
colors = ['darkblue', '$amber']

q.page['example'] = ui.stat_table_card(
    box='1 1 4 4',
    title='Contacts',
    subtitle='Last updated: 2022-04-13',
    columns=['Name', 'Job', 'City'],
    items=[ui.stat_table_item(label='Joe Doe', values=values, colors=colors) for _ in range(5)]
)