Graphics
Wave provides a versatile API for rendering vector graphics (SVG) backed by data buffers.
Use the graphics card ui.graphics_card() to render graphics.
Stages and scenes
The graphics card has two attributes that control how graphics are rendered: stage and scene:
- A stage holds static shapes that are rendered as part of the background (literally, behind the scene).
- A scene holds shapes whose attributes need to be animated (causing a re-render, or, literally, cause a scene).
Use ui.stage() and ui.scene() to create the stage and the scene:
ui.stage()creates a packed, static representation of its shapes (recall that the stage is not supposed to change).ui.scene()declares a data buffer to efficiently update its shapes if changed (recall that the scene is animated).
Here's an example that draws a clock with a circular face placed on the stage, and hour, min and sec hands placed in the scene:
from h2o_wave import site, ui, graphics as g

page = site['/demo']
page['example'] = ui.graphics_card(
    box='1 1 2 3', view_box='0 0 100 100', width='100%', height='100%',
    stage=g.stage(
        face=g.circle(cx='50', cy='50', r='45', fill='#111', stroke_width='2px', stroke='#f55'),
    ),
    scene=g.scene(
        hour=g.rect(x='47.5', y='12.5', width='5', height='40', rx='2.5', fill='#333', stroke='#555'),
        min=g.rect(x='48.5', y='12.5', width='3', height='40', rx='2', fill='#333', stroke='#555'),
        sec=g.line(x1='50', y1='50', x2='50', y2='16', stroke='#f55', stroke_width='1px'),
    ),
)
Shapes
Use drawing functions to add shapes to the stage or scene:
| Primitive | Use |
|---|---|
| arc() | Circular or annular sector, as in a pie or donut chart |
| circle() | Circle |
| ellipse() | Ellipse |
| image() | Image |
| line() | Line |
| path() | Path |
| polygon() | Polygon |
| polyline() | Polyline |
| spline() | Curves (including radial curves) using various algorithms: basis, cardinal, smooth, linear, monotone, natural, step. |
| rect() | Rect |
| text() | Text |
Paths
The path() function is special: it can draw arbitrary shapes. This is because SVG path elements support an attribute called d which holds drawing commands.
Here's a path that represents a red square:
g.path(d='m 25 25 h 50 v 50 h -50 z', fill='red')
The above snippet produces:
<path d='m 25 25 h 50 v 50 h -50 z' fill='red'/>
The drawing commands in the above example work like this:
m 25 25: Move 25px left, 25px downh 50: Draw a line 50px rightv 50: Draw a line 50px downh -50: Draw a line 50px leftz: Close the path (going back to where we started)
The little drawing syntax above is part of the SVG specification, not something unique to Wave.
Authoring path() drawing commands by hand is tedious, so Wave provides two utilities to make it easier: p() and turtle().
Drawing with paths
p() creates a path generator with convenience methods to draw step by step. For example, the following two lines are equivalent:
red_square = g.path(d='m 25 25 h 50 v 50 h -50 z', fill='red')
red_square = g.p().m(25, 25).h(50).v(50).h(-50).z().path(fill='red')
Commands
| Method | Use |
|---|---|
M() | Move, absolute |
H() | Horizontal line, absolute |
V() | Vertical line, absolute |
L() | Line, absolute |
A() | Elliptical arc, absolute |
C() | Cubic Bézier curve, absolute |
S() | Cubic Bézier curve, smooth, absolute |
Q() | Quadratic Bézier curve, absolute |
T() | Quadratic Bézier curve, smooth, absolute |
Z() | Close path |
m() | Move, relative |
h() | Horizontal line, relative |
v() | Vertical line, relative |
l() | Line, relative |
a() | Elliptical arc, relative |
c() | Cubic Bézier curve, relative |
s() | Cubic Bézier curve, smooth, relative |
q() | Quadratic Bézier curve, relative |
t() | Quadratic Bézier curve, smooth, relative |
z() | Close path |
d() | Serialize this path's commands into SVG path data. |
path() | Create a SVG path element |
The upper-cased commands use absolute coordinates. The lower-cased commands use relative coordinates. For example, L(4,2) means "draw a line to (4,2)", but l(4,2) means "draw a line 4px right, 2px down from the current position".
Drawing with a turtle
turtle() creates a path generator (similar to p()), but using Turtle Geometry.
Commands
| Method | Use |
|---|---|
pd() | Pen down |
pu() | Pen up |
p() | Set the turtle's position |
a() | Set the turtle's orientation |
f() | Move forward |
b() | Move backward |
l() | Turn left |
r() | Turn right |
d() | Serialize this turtle's movements into SVG path data |
path() | Create a SVG path element |
Example
Here is an example from Python's turtle module:
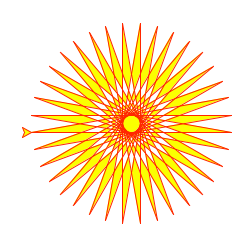
Here is the above example recreated in Wave:
from turtle import *
color('red', 'yellow')
begin_fill()
while True:
    forward(200)
    left(170)
    if abs(pos()) < 1:
        break
end_fill()
done()
from h2o_wave import site, ui, graphics as g

t = g.turtle().f(100).r(90).pd()
for _ in range(36):
    t.f(200).l(170)
spirograph = t.pu(1).path(stroke='red', fill='yellow')

page = site['/demo']
page['example'] = ui.graphics_card(
    box='1 1 2 3', view_box='0 0 220 220', width='100%', height='100%',
    scene=g.scene(foo=spirograph),
)

page.save()
Turtle graphics is not just kid stuff: See Turtle Geometry by Harold Abelson and Andrea diSessa.