Interactions
Wave plots are not just a static display but allow for various interactions for your users to better explore the data. If you didn't find the interaction you want, do not hesitate and file a feature request.
Zoom
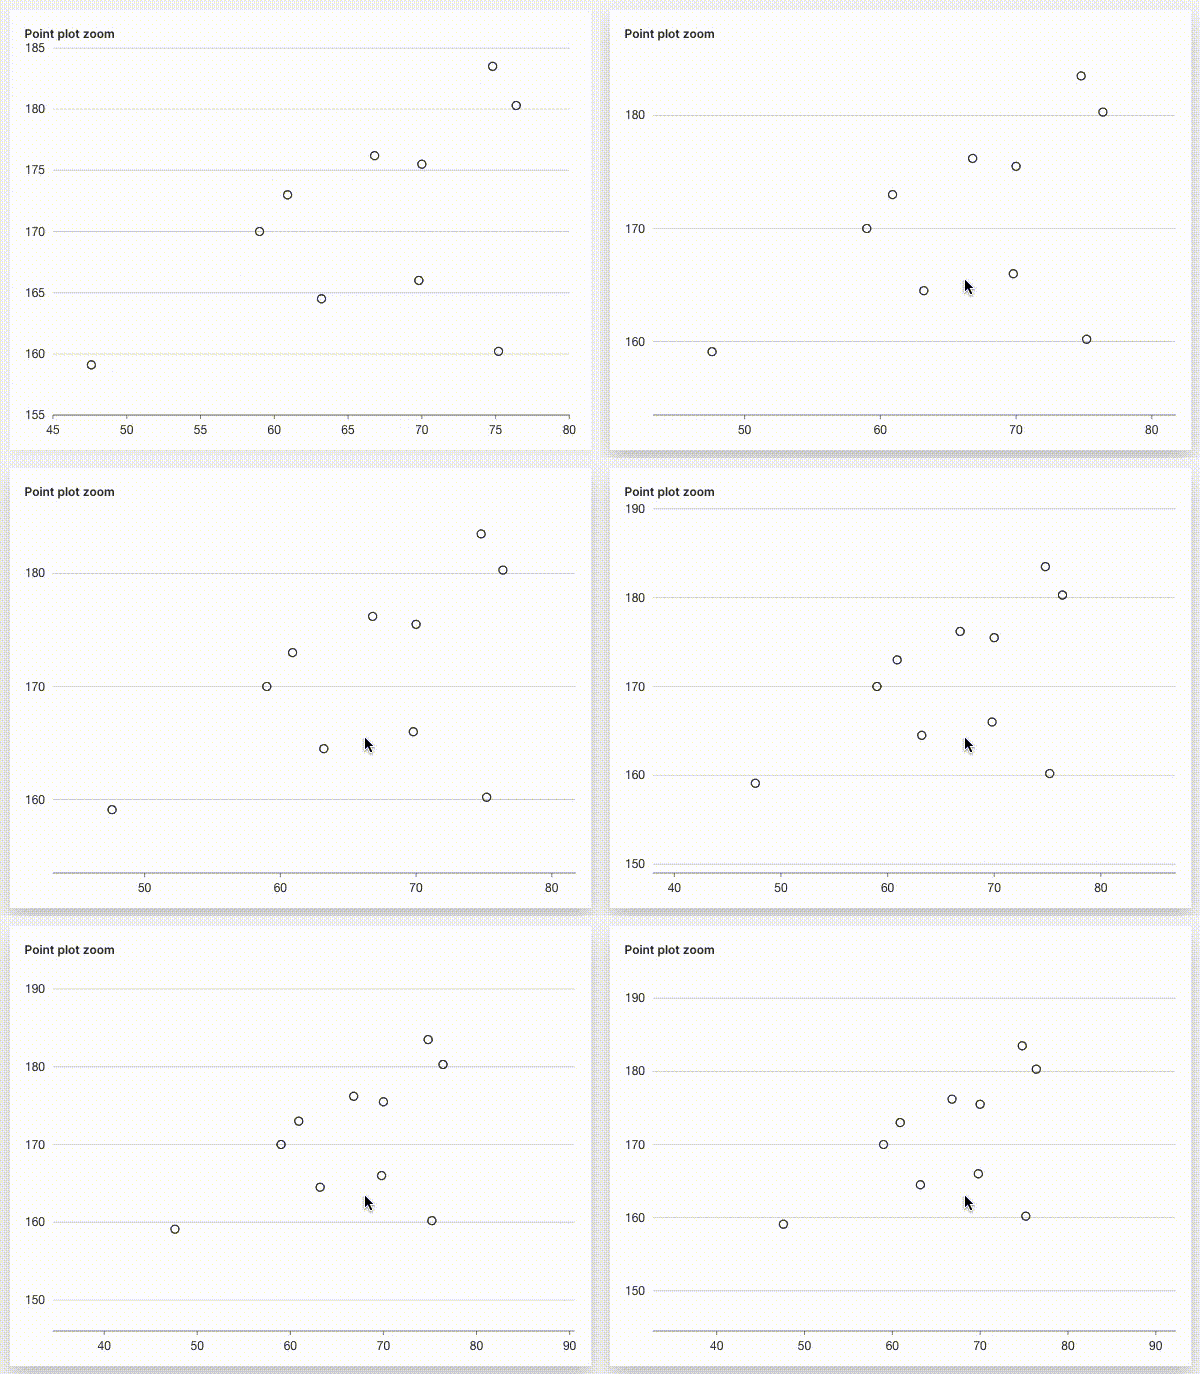
Zoom in and out via a mouse wheel.

q.page['example'] = ui.plot_card(
    box='1 1 4 5',
    title='Point plot zoom',
    data=data('height weight', 10, rows=[
        (170, 59),
        (159.1, 47.6),
        (166, 69.8),
        (176.2, 66.8),
        (160.2, 75.2),
        (180.3, 76.4),
        (164.5, 63.2),
        (173, 60.9),
        (183.5, 74.8),
        (175.5, 70),
    ]),
    # Register an interaction.
    interactions=['scale_zoom'],
    plot=ui.plot([ui.mark(type='point', x='=weight', y='=height')])
)
Brush
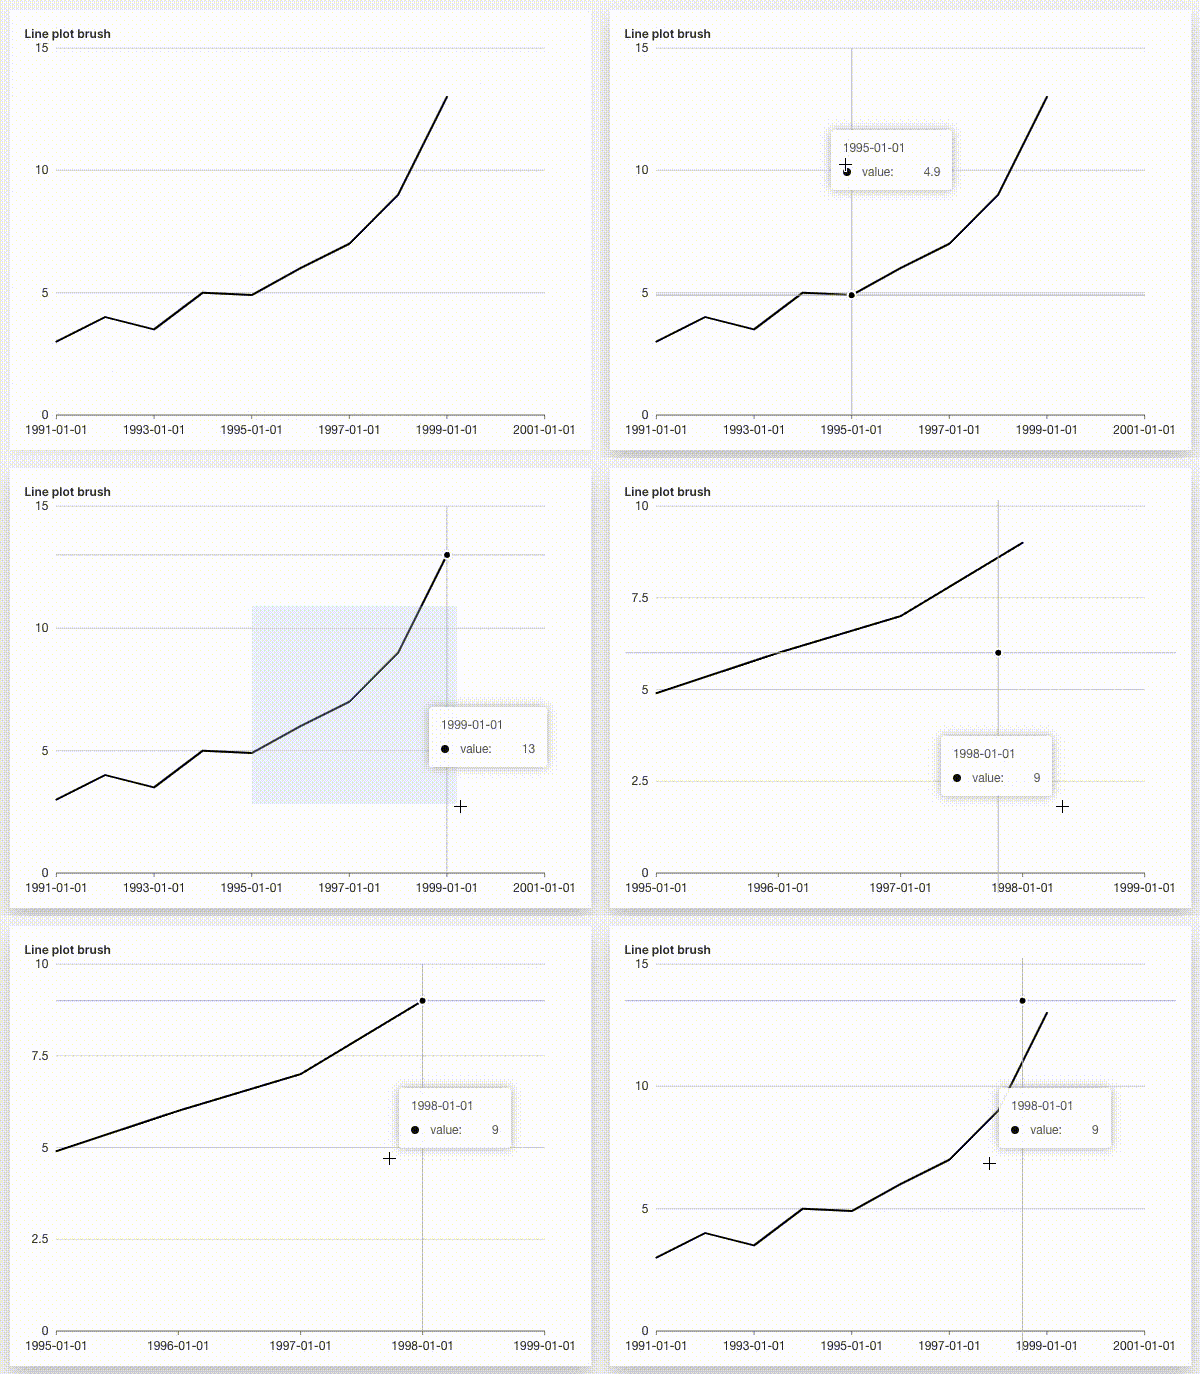
Drag a rectangle with a left mouse click and double-click to reset.

q.page['example'] = ui.plot_card(
    box='1 1 4 5',
    title='Line plot brush',
    data=data('year value', 8, rows=[
        ('1991', 3),
        ('1992', 4),
        ('1993', 3.5),
        ('1994', 5),
        ('1995', 4.9),
        ('1996', 6),
        ('1997', 7),
        ('1998', 9),
        ('1999', 13),
    ]),
    plot=ui.plot([ui.mark(type='line', x_scale='time', x='=year', y='=value', y_min=0)]),
    # Register an interaction.
    interactions=['brush']
)
Drag
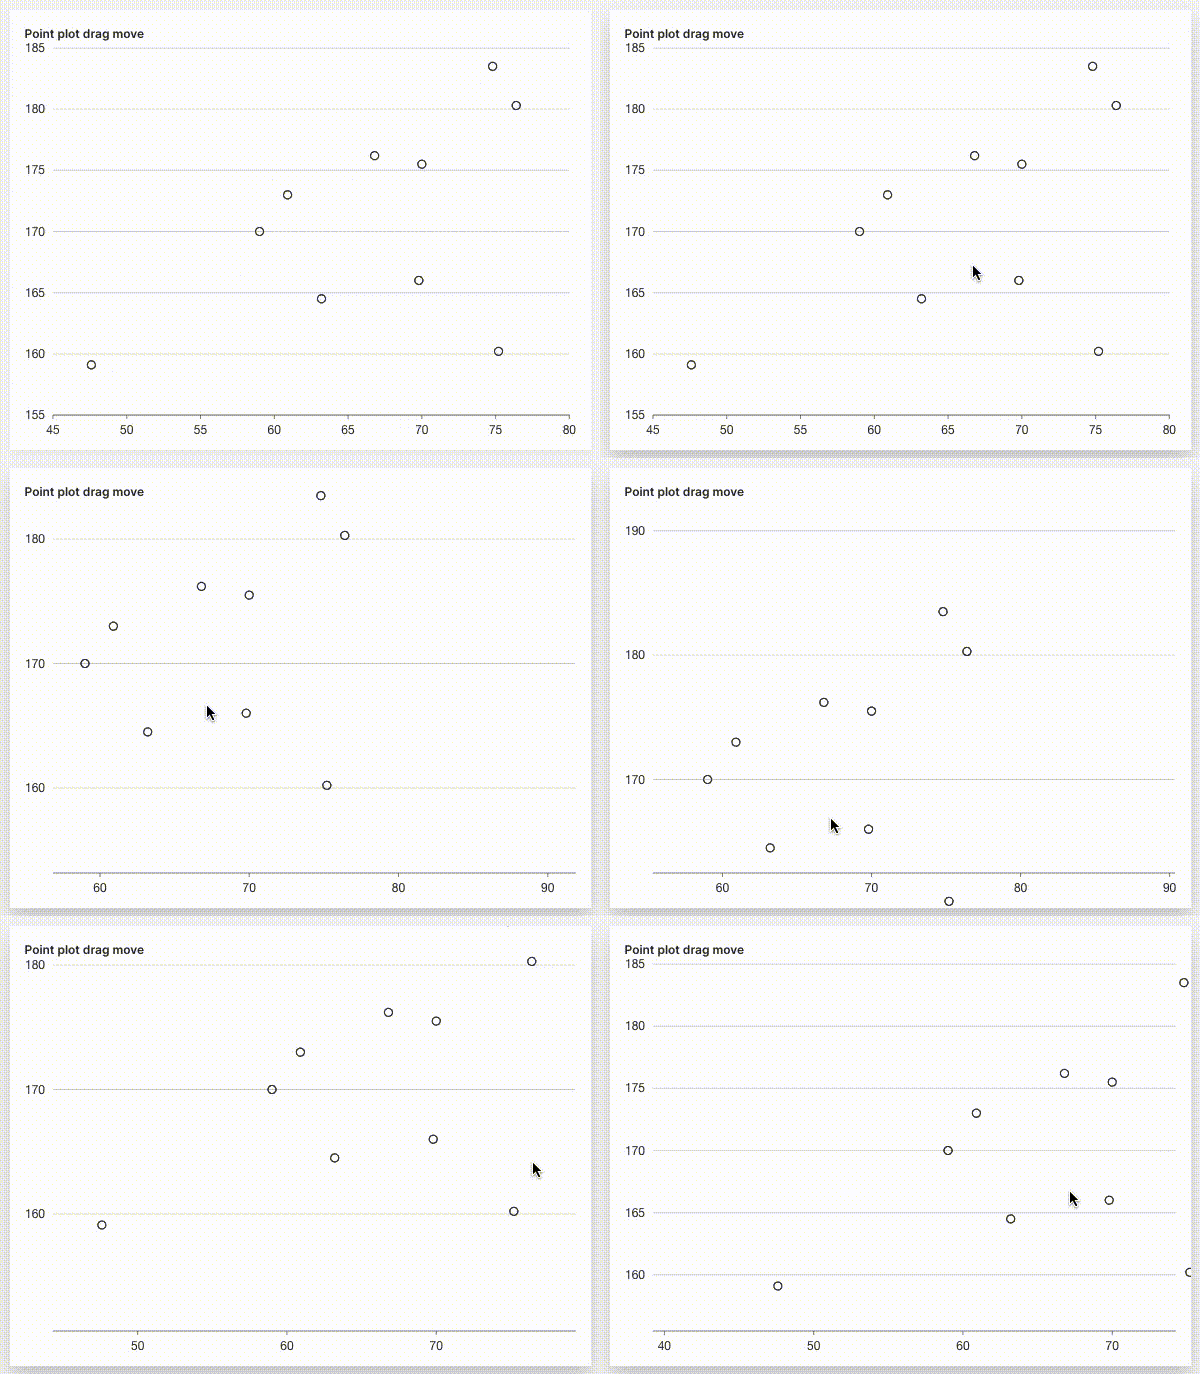
Drag with a left mouse click and move around the plot.

q.page['example'] = ui.plot_card(
    box='1 1 4 5',
    title='Point plot drag move',
    data=data('height weight', 10, rows=[
        (170, 59),
        (159.1, 47.6),
        (166, 69.8),
        (176.2, 66.8),
        (160.2, 75.2),
        (180.3, 76.4),
        (164.5, 63.2),
        (173, 60.9),
        (183.5, 74.8),
        (175.5, 70),
    ]),
    # Register an interaction.
    interactions=['drag_move'],
    plot=ui.plot([ui.mark(type='point', x='=weight', y='=height')])
)