Altair
If you, for some reason, do not want to use native Wave plots, you can use what you already know like Altair for example.
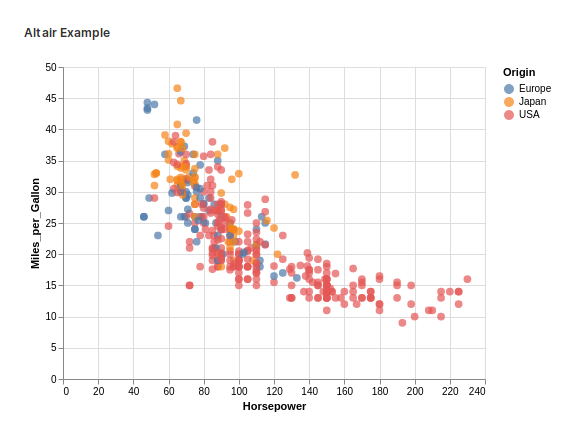
import altair
from vega_datasets import data

spec = altair.Chart(data.cars()).mark_circle(size=60).encode(
    x='Horsepower',
    y='Miles_per_Gallon',
    color='Origin',
    tooltip=['Name', 'Origin', 'Horsepower', 'Miles_per_Gallon']
).properties(width='container', height='container').interactive().to_json()

q.page['example'] = ui.vega_card(
    box='1 1 4 5',
    title='Altair Example',
    specification=spec,
)