Interval
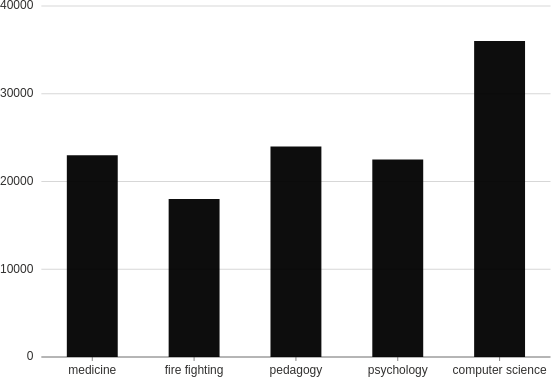
Create interval plots, usually bar charts. Interval plots are good for showing how your data is trending.
from h2o_wave import data

q.page['example'] = ui.plot_card(
    box='1 1 4 5',
    title='Interval',
    data=data('profession salary', 5, rows=[
        ('medicine', 23000),
        ('fire fighting', 18000),
        ('pedagogy', 24000),
        ('psychology', 22500),
        ('computer science', 36000),
    ]),
    plot=ui.plot([ui.mark(type='interval', x='=profession', y='=salary', y_min=0)])
)
Check the full API at ui.plot_card.
Transpose
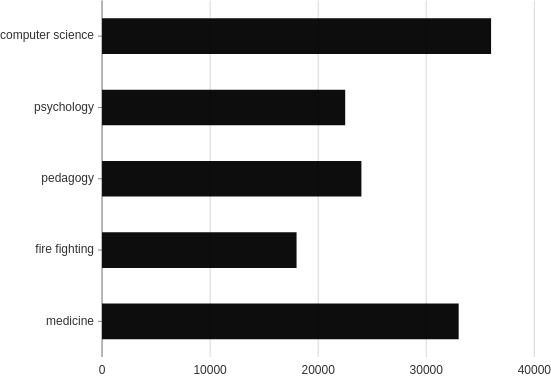
To transpose the plot, simply switch the x and y coordinate values.
from h2o_wave import data

q.page['example'] = ui.plot_card(
    box='1 1 4 5',
    title='Interval transposed',
    data=data('profession salary', 5, rows=[
        ('medicine', 33000),
        ('fire fighting', 18000),
        ('pedagogy', 24000),
        ('psychology', 22500),
        ('computer science', 36000),
    ]),
    plot=ui.plot([ui.mark(type='interval', x='=salary', y='=profession', y_min=0)])
)
Stacked
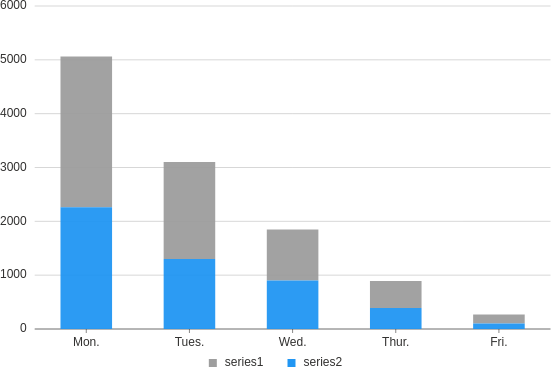
Useful when you want to display the third dimension to your bar charts and would like to emphasize the difference in totals across columns.
from h2o_wave import data

q.page['example'] = ui.plot_card(
    box='1 1 4 5',
    title='Intervals, stacked',
    data=data('day type time', 10, rows=[
        ('Mon.','series1', 2800),
        ('Mon.','series2', 2260),
        ('Tues.','series1', 1800),
        ('Tues.','series2', 1300),
        ('Wed.','series1', 950),
        ('Wed.','series2', 900),
        ('Thur.','series1', 500),
        ('Thur.','series2', 390),
        ('Fri.','series1', 170),
        ('Fri.','series2', 100),
    ]),
    plot=ui.plot([
        ui.mark(type='interval', x='=day', y='=time', color='=type', stack='auto', y_min=0)
    ])
)
Grouped
Make a grouped column plot.
from h2o_wave import data

q.page['example'] = ui.plot_card(
    box='1 1 4 5',
    title='Intervals, groups',
    data=data('day type time', 10, rows=[
        ('Mon.','series1', 2800),
        ('Mon.','series2', 2260),
        ('Tues.','series1', 1800),
        ('Tues.','series2', 1300),
        ('Wed.','series1', 950),
        ('Wed.','series2', 900),
        ('Thur.','series1', 500),
        ('Thur.','series2', 390),
        ('Fri.','series1', 170),
        ('Fri.','series2', 100),
    ]),
    plot=ui.plot([ui.mark(type='interval', x='=day', y='=time', color='=type', dodge='auto', y_min=0)])
)
Stacked grouped
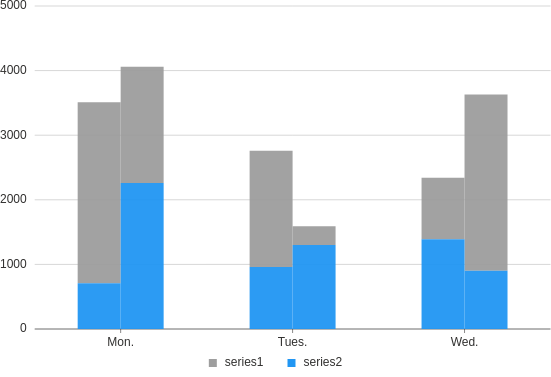
Make a column plot with both stacked and grouped bars.
from h2o_wave import data

q.page['example'] = ui.plot_card(
    box='1 1 4 5',
    title='Intervals, stacked and dodged',
    data=data('day type time gender', 12, rows=[
        ('Mon.','series1', 2800, 'male'),
        ('Mon.','series1', 1800, 'female'),
        ('Mon.','series2', 2260, 'female'),
        ('Mon.','series2', 710, 'male'),
        ('Tues.','series1', 1800, 'male'),
        ('Tues.','series1', 290, 'female'),
        ('Tues.','series2', 1300, 'female'),
        ('Tues.','series2', 960, 'male'),
        ('Wed.','series1', 950, 'male'),
        ('Wed.','series1', 2730, 'female'),
        ('Wed.','series2', 1390, 'male'),
        ('Wed.','series2', 900, 'female'),
    ]),
    plot=ui.plot([
        ui.mark(
            type='interval',
            x='=day',
            y='=time',
            color='=type',
            stack='auto',
            dodge='=gender',
            y_min=0
        )
    ])
)
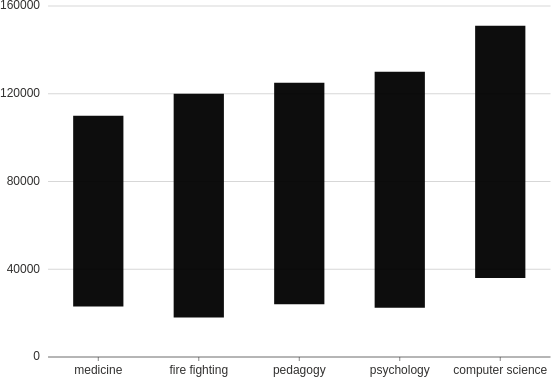
Range
Make a column plot with each bar representing high/low (or start/end) values.
from h2o_wave import data

q.page['example'] = ui.plot_card(
    box='1 1 4 5',
    title='Interval, range',
    data=data('profession max min', 5, rows=[
        ('medicine', 110000, 23000),
        ('fire fighting', 120000, 18000),
        ('pedagogy', 125000, 24000),
        ('psychology', 130000, 22500),
        ('computer science', 151000, 36000),
    ]),
    plot=ui.plot([ui.mark(type='interval', x='=profession', y0='=min', y='=max')])
)
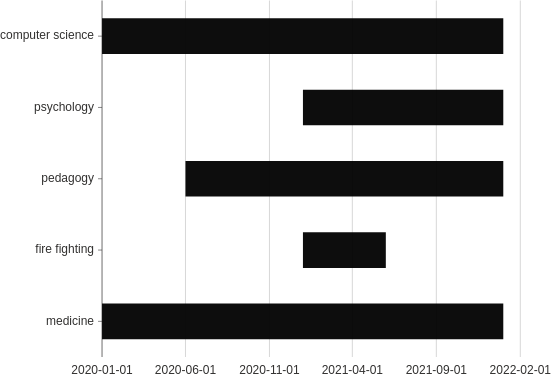
Gantt
Make a Gantt plot with each bar representing high/low (or start/end) values.
from h2o_wave import data

q.page['example'] = ui.plot_card(
    box='1 1 4 5',
    title='Interval, range',
    data=data('profession max min', 5, rows=[
        ('medicine', '2022-01-01', '2020-01-01'),
        ('fire fighting', '2021-06-01', '2021-01-01'),
        ('pedagogy', '2020-06-01', '2022-01-01'),
        ('psychology', '2021-01-01', '2022-01-01'),
        ('computer science', '2020-01-01', '2022-01-01'),
    ]),
    plot=ui.plot([ui.mark(type='interval', y='=profession', x_scale='time', x0='=min', x='=max')])
)
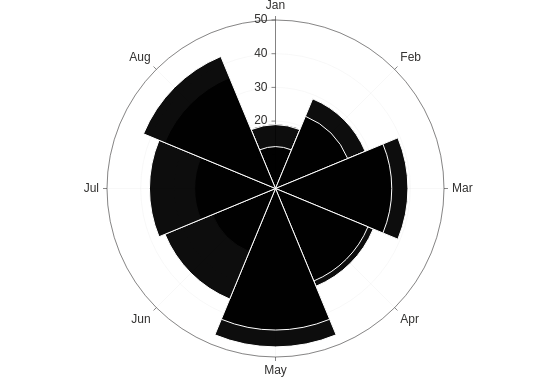
Polar
Make a rose plot (a bar plot in polar coordinates).
from h2o_wave import data

q.page['example'] = ui.plot_card(
    box='1 1 4 5',
    title='Interval, polar',
    data=data('month rainfall', 16, rows=[
        ('Jan', 18.9),
        ('Feb', 28.8),
        ('Mar', 39.3),
        ('Apr', 31.4),
        ('May', 47),
        ('Jun', 20.3),
        ('Jul', 24),
        ('Aug', 35.6),
        ('Jan', 12.4),
        ('Feb', 23.2),
        ('Mar', 34.5),
        ('Apr', 29.7),
        ('May', 42),
        ('Jun', 35.5),
        ('Jul', 37.4),
        ('Aug', 42.4),
    ]),
    plot=ui.plot([ui.mark(coord='polar', type='interval', x='=month', y='=rainfall', y_min=0, stroke_color='$card')])
)
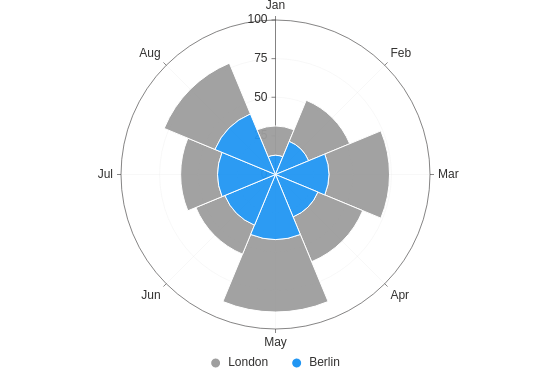
Polar stacked
Make a stacked rose plot (a stacked bar plot in polar coordinates).
from h2o_wave import data

q.page['example'] = ui.plot_card(
    box='1 1 4 5',
    title='Intervals, polar, stacked',
    data=data('city month rainfall', 16, rows=[
        ('London', 'Jan', 18.9),
        ('London', 'Feb', 28.8),
        ('London', 'Mar', 39.3),
        ('London', 'Apr', 31.4),
        ('London', 'May', 47),
        ('London', 'Jun', 20.3),
        ('London', 'Jul', 24),
        ('London', 'Aug', 35.6),
        ('Berlin', 'Jan', 12.4),
        ('Berlin', 'Feb', 23.2),
        ('Berlin', 'Mar', 34.5),
        ('Berlin', 'Apr', 29.7),
        ('Berlin', 'May', 42),
        ('Berlin', 'Jun', 35.5),
        ('Berlin', 'Jul', 37.4),
        ('Berlin', 'Aug', 42.4),
    ]),
    plot=ui.plot([
        ui.mark(
            coord='polar',
            type='interval',
            x='=month',
            y='=rainfall',
            color='=city',
            stack='auto',
            y_min=0,
            stroke_color='$card'
        )
    ])
)
Theta
Make a "racetrack" plot (a bar plot in polar coordinates, transposed).
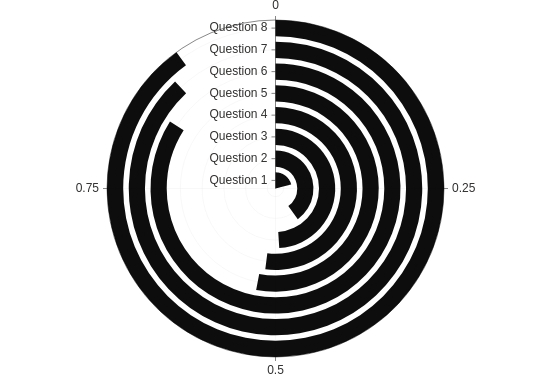
from h2o_wave import data

q.page['example'] = ui.plot_card(
    box='1 1 4 5',
    title='Intervals, theta',
    data=data('question percent', 8, rows=[
        ('Question 1', 0.21),
        ('Question 2', 0.4),
        ('Question 3', 0.49),
        ('Question 4', 0.52),
        ('Question 5', 0.53),
        ('Question 6', 0.84),
        ('Question 7', 0.88),
        ('Question 8', 0.9),
    ]),
    plot=ui.plot([
        ui.mark(coord='theta', type='interval', x='=question', y='=percent', stack='auto', y_min=0)
    ])
)
Theta stacked
Make a stacked "racetrack" plot.
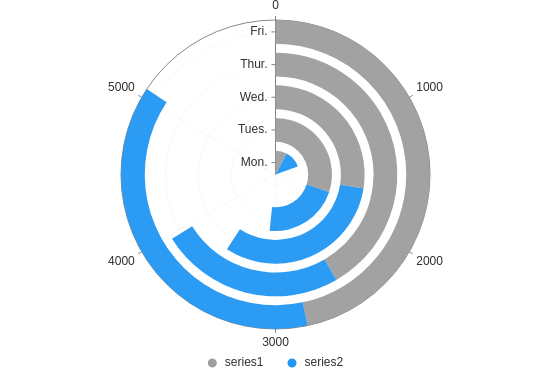
from h2o_wave import data

q.page['example'] = ui.plot_card(
    box='1 1 4 5',
    title='Intervals, theta, stacked',
    data=data('day type time', 10, rows=[
        ('Mon.','series1', 470),
        ('Mon.','series2', 700),
        ('Tues.','series1', 1800),
        ('Tues.','series2', 1300),
        ('Wed.','series1', 1650),
        ('Wed.','series2', 1900),
        ('Thur.','series1', 2500),
        ('Thur.','series2', 1470),
        ('Fri.','series1', 2800),
        ('Fri.','series2', 2260),
    ]),
    plot=ui.plot([
        ui.mark(
            coord='theta',
            type='interval',
            x='=day',
            y='=time',
            color='=type',
            stack='auto',
            y_min=0
        )
    ])
)
Labels
Make a column plot with labels on each bar.
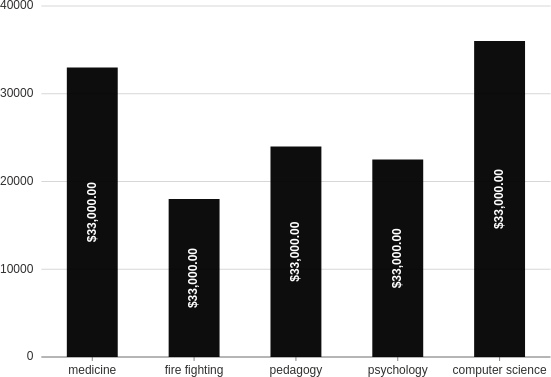
from h2o_wave import data

q.page['example'] = ui.plot_card(
    box='1 1 4 5',
    title='Label Customization',
    data=data('profession salary', 5, rows=[
        ('medicine', 33000),
        ('fire fighting', 18000),
        ('pedagogy', 24000),
        ('psychology', 22500),
        ('computer science', 36000),
    ]),
    plot=ui.plot([
        ui.mark(
            type='interval',
            x='=profession',
            y='=salary', y_min=0,
            label='=${{intl salary minimum_fraction_digits=2 maximum_fraction_digits=2}}',
            label_offset=0, label_position='middle', label_rotation='-90', label_fill_color='#fff',
            label_font_weight='bold'
        )
    ])
)
Helix
Make a bar plot in helical coordinates.
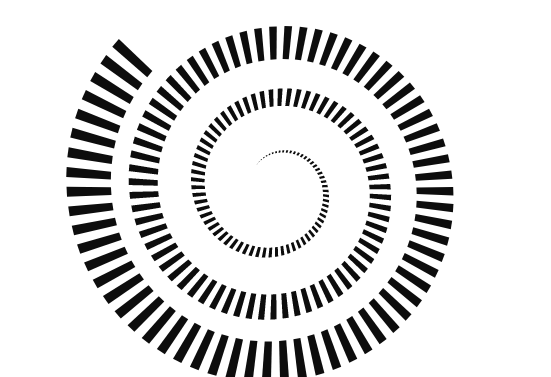
from h2o_wave import data

q.page['example'] = ui.plot_card(
    box='1 1 4 5',
    title='Interval, helix',
    data=data('product price', 200, rows=[ (f'P{i}', i) for i in range(200)]),
    plot=ui.plot([ui.mark(coord='helix', type='interval', x='=product', y='=price', y_min=0)])
)
Histogram
Best used for numerical data when the shape of the distribution is needed.
from h2o_wave import data

q.page['example'] = ui.plot_card(
    box='1 1 4 5',
    title='Interval, range',
    data=data('price low high', 8, rows=[
        (4, 50, 100),
        (6, 100, 150),
        (8, 150, 200),
        (16, 350, 400),
        (18, 400, 450),
        (10, 200, 250),
        (12, 250, 300),
        (14, 300, 350),
    ]),
    plot=ui.plot([ui.mark(type='interval', y='=price', x1='=low', x2='=high', y_min=0)])
)