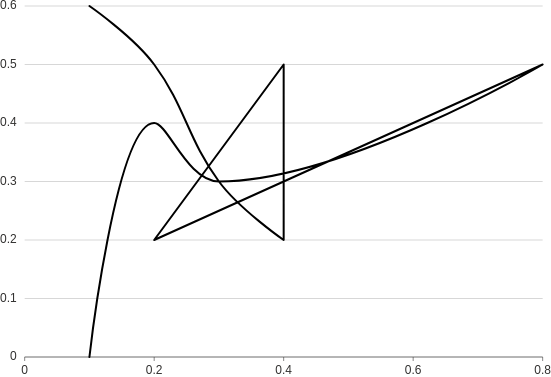
Path
Use this type of plot to show the deflection of many data points at the same time.

from h2o_wave import data

q.page['example'] = ui.plot_card(
    box='1 1 5 5',
    title='Path',
    data=data('price performance', 10, rows=[
        (0.1, 0.6),
        (0.2, 0.5),
        (0.3, 0.3),
        (0.4, 0.2),
        (0.4, 0.5),
        (0.2, 0.2),
        (0.8, 0.5),
        (0.3, 0.3),
        (0.2, 0.4),
        (0.1, 0.0),
    ]),
    plot=ui.plot([ui.mark(type='path', x='=price', y='=performance')])
)
Check the full API at ui.plot_card.
Smooth
from h2o_wave import data

q.page['example'] = ui.plot_card(
    box='1 1 4 5',
    title='Path, smooth',
    data=data('price performance', 10, rows=[
        (0.1, 0.6),
        (0.2, 0.5),
        (0.3, 0.3),
        (0.4, 0.2),
        (0.4, 0.5),
        (0.2, 0.2),
        (0.8, 0.5),
        (0.3, 0.3),
        (0.2, 0.4),
        (0.1, 0.0),
    ]),
    plot=ui.plot([ui.mark(type='path', x='=price', y='=performance', curve='smooth')])
)
Point
Make a path plot with an additional layer of points.
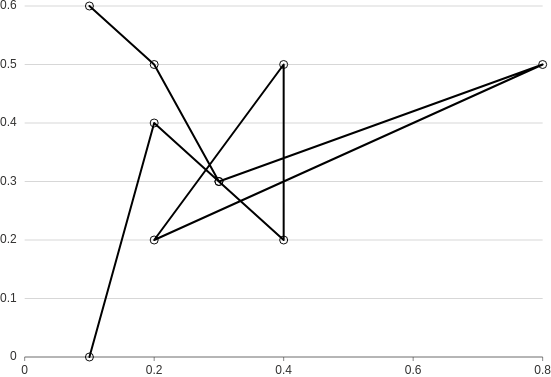
from h2o_wave import data

q.page['example'] = ui.plot_card(
    box='1 1 4 5',
    title='Path, point',
    data=data('price performance', 10, rows=[
        (0.1, 0.6),
        (0.2, 0.5),
        (0.3, 0.3),
        (0.4, 0.2),
        (0.4, 0.5),
        (0.2, 0.2),
        (0.8, 0.5),
        (0.3, 0.3),
        (0.2, 0.4),
        (0.1, 0.0),
    ]),
    plot=ui.plot([
        ui.mark(type='path', x='=price', y='=performance'),
        ui.mark(type='point', x='=price', y='=performance'),
    ])
)