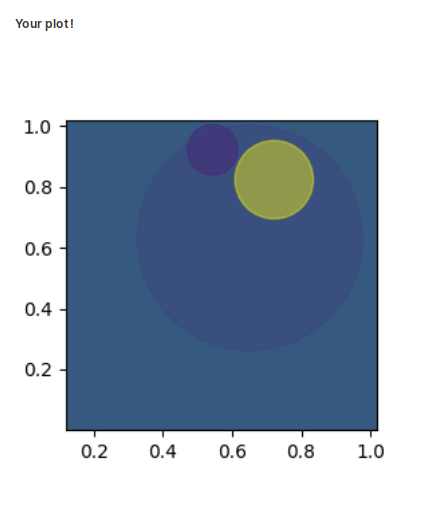
Matplotlib
If you, for some reason, do not want to use native Wave plots, you can use what you already know like Matplotlib for example.
import matplotlib.pyplot as plt
import base64
import io

n = 25

# Render plot.
plt.figure(figsize=(3, 3))
plt.scatter(
    [
        0.7003673, 0.74275081, 0.70928001, 0.56674552, 0.97778533, 0.70633485,
        0.24791576,0.15788335,0.69769852,0.71995667,0.25774443,0.34154678,
        0.96876117,0.6945071, 0.46638326,0.7028127, 0.51178587,0.92874137,
        0.7397693, 0.62243903,0.65154547,0.39680761,0.54323939,0.79989953,
        0.72154473
    ],
    [
        0.29536398,0.16094588,0.20612551,0.13432539,0.48060502,0.34252181,
        0.36296929,0.97291764,0.11094361,0.38826409,0.78306588,0.97289726,
        0.48320961,0.33642111,0.56741904,0.04794151,0.38893703,0.90630365,
        0.16101821,0.74362113,0.63297416,0.32418002,0.92237653,0.23722644,
        0.82394557
    ],
    s=[
        1170181.4851974829, 617.9227060309893, 1882659.557987025, 2990027.061125281,
        2686350.8652529297, 8767.750248552493, 2794018.9231110364, 210781.95635096994,
        187217.9978718658, 233.03882583210552, 10306.76430585089, 968506.8183026987,
        223342.29553498022, 1272409.8495015553, 2384403.052842464, 1310911.6706234452,
        2724256.379836172, 526162.3051501286, 507286.75042912073, 810149.8800767765,
        14634.810032562187, 1816527.2555962182, 729.7430268759722, 1489180.4306229409,
        1771.6877572378442
    ],
    c=[
        0.90687198,0.78837333,0.76840584,0.59849648,0.44214562,0.72303802,
        0.41661825,0.2268104, 0.45422734,0.84794375,0.93665595,0.95603618,
        0.39209432,0.70832467,0.12951583,0.35379639,0.40427152,0.6485339,
        0.03307097,0.53800936,0.13171312,0.52093493,0.10248479,0.15798038,
        0.92002965
    ],
    alpha= 0.5
)
# Convert to base64.
pic_IObytes = io.BytesIO()
plt.savefig(pic_IObytes,  format='png')
pic_IObytes.seek(0)
image = base64.b64encode(pic_IObytes.read()).decode()

# Display the plot in an image card.
q.page['plot'] = ui.image_card(box='1 1 3 6', title='Your plot!', image=image, type='png')