D3
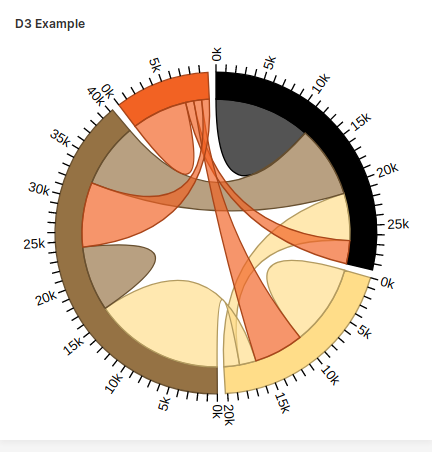
If you, for some reason, do not want to use native Wave plots, you can use what you already know like D3.js for example.
import json

script = '''
const
  width = 300,
  height = Math.min(640, width),
  groupTicks = (d, step) => {{
    const k = (d.endAngle - d.startAngle) / d.value;
    return d3.range(0, d.value, step).map(value => {{
      return {{ value: value, angle: value * k + d.startAngle }};
    }});
  }},
  formatValue = d3.formatPrefix(",.0", 1e3),
  chord = d3.chord()
    .padAngle(0.05)
    .sortSubgroups(d3.descending),
  outerRadius = Math.min(width, height) * 0.5 - 30,
  innerRadius = outerRadius - 20,
  arc = d3.arc()
    .innerRadius(innerRadius)
    .outerRadius(outerRadius),
  ribbon = d3.ribbon()
    .radius(innerRadius),
  color = d3.scaleOrdinal()
    .domain(d3.range(4))
    .range(["#000000", "#FFDD89", "#957244", "#F26223"]),
  render = (data) => {{
    const svg = d3.select("#d3-chart")
      .append("svg")
      .attr("viewBox", [-width / 2, -height / 2, width, height])
      .attr("font-size", 10)
      .attr("font-family", "sans-serif");

    const chords = chord(data);

    const group = svg.append("g")
      .selectAll("g")
      .data(chords.groups)
      .join("g");

    group.append("path")
      .attr("fill", d => color(d.index))
      .attr("stroke", d => d3.rgb(color(d.index)).darker())
      .attr("d", arc);

    const groupTick = group.append("g")
      .selectAll("g")
      .data(d => groupTicks(d, 1e3))
      .join("g")
      .attr("transform", d => `rotate(${{d.angle * 180 / Math.PI - 90}}) translate(${{outerRadius}},0)`);

    groupTick.append("line")
      .attr("stroke", "#000")
      .attr("x2", 6);

    groupTick
      .filter(d => d.value % 5e3 === 0)
      .append("text")
      .attr("x", 8)
      .attr("dy", ".35em")
      .attr("transform", d => d.angle > Math.PI ? "rotate(180) translate(-16)" : null)
      .attr("text-anchor", d => d.angle > Math.PI ? "end" : null)
      .text(d => formatValue(d.value));

    svg.append("g")
      .attr("fill-opacity", 0.67)
      .selectAll("path")
      .data(chords)
      .join("path")
      .attr("d", ribbon)
      .attr("fill", d => color(d.target.index))
      .attr("stroke", d => d3.rgb(color(d.target.index)).darker());
  }};

  render({data})
'''

data = [
    [11975, 5871, 8916, 2868],
    [1951, 10048, 2060, 6171],
    [8010, 16145, 8090, 8045],
    [1013, 990, 940, 6907],
]
q.page['meta'] = ui.meta_card(
    box='',
    script=ui.inline_script(content=script.format(data=json.dumps(data)), requires=['d3']),
    scripts=[ui.script(path='https://d3js.org/d3.v5.min.js')],
)
content = '<div id="d3-chart" style="width:100%; height: 100%"></div>'
q.page['example'] = ui.markup_card(box='1 1 3 5', title='D3 Example', content=content)