Bokeh
If you, for some reason, do not want to use native Wave plots, you can use what you already know like Bokeh for example.
import numpy as np
from bokeh.models import HoverTool
from bokeh.plotting import figure
from bokeh.resources import CDN
from bokeh.embed import file_html
x = np.array([
-0.87633609, 3.62323163, 0.26378868, 2.77536429, 2.95623408, 1.36133908,
2.96869302, 2.38374607, 0.95194905, 4.81607015, 6.76827113, 0.97705378,
1.39207797, 3.1873381, 1.3616683, 3.73065256, 5.302055, 3.82115579,
3.17866883, 2.64249663
])
y = np.array([
3.27468642, 2.53723136, 1.40926674,-0.5951167, 3.55712746, 2.7915528,
2.77181023, 0.97091619, 0.71984387, 0.28563688, 3.11202777, 0.98304415,
0.1553476, 0.07045039, 2.92534369, 4.50105315, 0.32655986, 2.77604486,
-2.54695983, 2.20592779
])
p = figure(
match_aspect=True,
tools='wheel_zoom,reset',
background_fill_color='#440154',
sizing_mode='stretch_both'
)
p.grid.visible = False
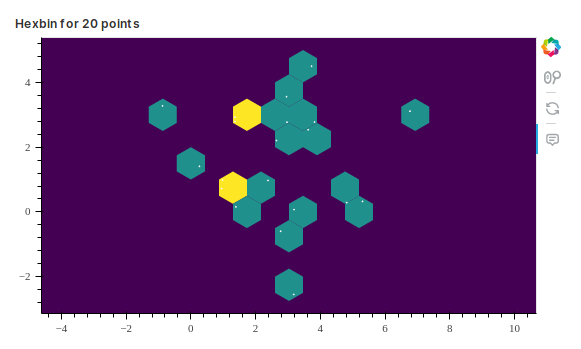
r, bins = p.hexbin(x, y, size=0.5, hover_color='pink', hover_alpha=0.8)
p.circle(x, y, color='white', size=1)
p.add_tools(HoverTool(
tooltips=[('count', '@c'), ('(q,r)', '(@q, @r)')],
mode='mouse',
point_policy='follow_mouse',
renderers=[r]
))
# Export html for a frame card.
html = file_html(p, CDN, 'plot')
q.page['example'] = ui.frame_card(box='1 1 4 4', title='Hexbin for 20 points', content=html)