Plotly
If you, for some reason, do not want to use native Wave plots, you can use what you already know like Plotly for example.
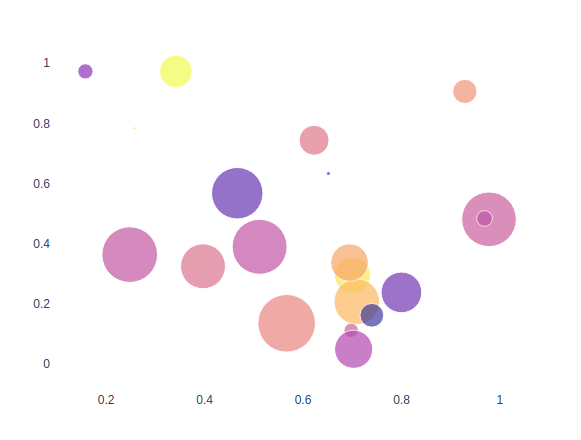
from plotly import graph_objects as go
from plotly import io as pio

# Create plot with plotly
fig = go.Figure(data=go.Scatter(
    x=[
        0.7003673, 0.74275081, 0.70928001, 0.56674552, 0.97778533, 0.70633485,
        0.24791576,0.15788335,0.69769852,0.71995667,0.25774443,0.34154678,
        0.96876117,0.6945071, 0.46638326,0.7028127, 0.51178587,0.92874137,
        0.7397693, 0.62243903,0.65154547,0.39680761,0.54323939,0.79989953,
        0.72154473
    ],
    y=[
        0.29536398,0.16094588,0.20612551,0.13432539,0.48060502,0.34252181,
        0.36296929,0.97291764,0.11094361,0.38826409,0.78306588,0.97289726,
        0.48320961,0.33642111,0.56741904,0.04794151,0.38893703,0.90630365,
        0.16101821,0.74362113,0.63297416,0.32418002,0.92237653,0.23722644,
        0.82394557
    ],
    mode='markers',
    marker=dict(
              size=[
                  36.05830903161469, 0.8286017043663844, 45.7366806110688, 57.63898238292554,
                  54.633637026336416, 3.1212088556541486, 55.71773030304962, 15.303665368901004,
                  14.422898378460776, 0.5088536417304483, 3.3840745174765763, 32.80424800240052,
                  15.753034823486491, 37.6003819351399, 51.47170800916282, 38.165017003991224,
                  55.01773835002037, 24.17901535423109, 23.741355161853022, 30.002775428593946,
                  4.032480630601988, 44.92620190188718, 0.9004585417540037, 40.67732688998109,
                  1.4030473806990602
              ],
              color=[
                  0.90687198,0.78837333,0.76840584,0.59849648,0.44214562,0.72303802,
                  0.41661825,0.2268104, 0.45422734,0.84794375,0.93665595,0.95603618,
                  0.39209432,0.70832467,0.12951583,0.35379639,0.40427152,0.6485339,
                  0.03307097,0.53800936,0.13171312,0.52093493,0.10248479,0.15798038,
                  0.92002965
              ]
            ),
    opacity=0.8,
))
_ = fig.update_layout(
    margin=dict(l=10, r=10, t=10, b=10),
    paper_bgcolor='rgb(255, 255, 255)',
    plot_bgcolor='rgb(255, 255, 255)',
)
config = {
    'scrollZoom': False,
    'showLink': False,
    'displayModeBar': False
}
html = pio.to_html(fig, validate=False, include_plotlyjs='cdn', config=config)

# Render the plot as an HTML.
q.page['example'] = ui.frame_card(box='1 1 4 5', title='', content=html)